From catastrophic hurricanes and blistering heatwaves to devastating floods and erratic cold snaps, the world is witnessing a noticeable surge in the intensity and frequency of extreme weather events. These aren’t just isolated incidents — they’re part of a larger, scientifically measurable shift that experts warn is accelerating.
Understanding the science behind extreme weather is not just for climate scientists anymore; it has become a global imperative. As these powerful natural forces continue to reshape communities, disrupt economies, and endanger lives, grasping the mechanisms driving them — from shifting jet streams to rising sea surface temperatures — helps societies prepare, adapt, and respond more effectively.

Therefore, in this article, we unpack the complex systems that fuel nature’s fury and explore how scientific advancements are helping us decode and confront one of humanity’s greatest challenges.
What Is the Science Behind Extreme Weather?
Extreme weather refers to unexpected, unusual, or severe weather conditions that significantly deviate from the average. These events include hurricanes, tornadoes, blizzards, droughts, floods, and heatwaves. While these occurrences are natural, their behaviour and impact are influenced by various atmospheric and environmental factors.
In recent years, we’ve seen this definition play out globally and locally. In South Africa, parts of KwaZulu-Natal were devastated by severe flooding in 2022 and 2023, displacing thousands and destroying infrastructure. In 2024, Cyclone Freddy set records across Southern Africa for being one of the longest-lived and most intense tropical storms, battering countries like Mozambique and Malawi.
What Causes Extreme Weather?
The science behind extreme weather is rooted in meteorology, the study of the atmosphere. Several key factors contribute to the formation of extreme weather events:
1. Jet Streams

Jet streams are narrow bands of strong winds located about 9 to 16 kilometres above Earth’s surface, in the upper levels of the troposphere. These high-altitude air currents can reach speeds exceeding 160 kilometres per hour and play a vital role in shaping global weather patterns by steering storms, influencing temperature shifts, and affecting precipitation.
Jet streams form where there are sharp contrasts in temperature between adjacent air masses, particularly near the boundaries of polar and tropical regions. The two most prominent jet streams are the Polar Jet Stream and the Subtropical Jet Stream. Their strength and position change with the seasons, often becoming more pronounced during winter when temperature gradients are steepest.
When jet streams flow smoothly from west to east, they typically bring predictable weather changes. However, disruptions—such as meandering or blocking patterns—can cause extreme and persistent weather. For instance:
- A “wavy” or meridional jet stream traps weather systems in place, leading to extended cold snaps, heatwaves, or flooding.
- A “cut-off” low or omega block can result in stagnant weather, often seen in prolonged droughts or heavy rainfall events.
Example: Europe’s 2023 Summer Heatwave
In the summer of 2023, Europe experienced a highly amplified, wavy jet stream that stalled over southern Europe. This configuration funnelled hot air into regions like Spain, Italy, and Greece, leading to:
- Temperatures soaring above 40°C for extended periods.
- Dozens of wildfires in Greece and Italy, displacing thousands.
- Severe crop failures, particularly in Spain, where olive oil production was halved.
- Significant power grid stress due to increased air conditioning use.
Scientists warn that climate change is slowing and destabilising jet streams, primarily because the Arctic is warming faster than the tropics, reducing the temperature gradient that powers these currents. This change increases the likelihood of prolonged extreme weather events—posing growing challenges to agriculture, infrastructure, and public health worldwide.
2. Air Pressure Systems

Air Pressure Systems: The Drivers of Weather Extremes
Atmospheric pressure systems—commonly referred to as high-pressure (anticyclones) and low-pressure (cyclones)—are central to how weather behaves around the world. These systems form due to uneven heating of Earth’s surface and vary by altitude, geography, and season.
- High-pressure systems (H): These are areas where atmospheric pressure is higher than the surrounding regions. Air in these systems descends, which inhibits cloud formation and leads to calm, dry, and often hot weather. They can cause heatwaves, drought conditions, and stagnant air, worsening air pollution and health risks.
- Low-pressure systems (L): These areas of lower atmospheric pressure encourage air to rise, cool, and condense, forming clouds and precipitation. These systems are typically associated with rain, snow, wind, and storms—ranging from everyday showers to massive cyclones and hurricanes.
Why Interactions Matter
When high- and low-pressure systems interact, they create sharp gradients in temperature and wind, often resulting in powerful and sometimes catastrophic weather. For example:
- Hurricanes and cyclones form over warm oceans when intense low-pressure zones interact with moist, rising air.
- Blizzards emerge when cold, dry air from a high-pressure system collides with warm, moist air from a low-pressure front.
- These boundaries, known as fronts, are where most dynamic weather occurs.
Example: The 2025 Texas Winter Storm
In February 2025, Texas endured a devastating winter storm that crippled its infrastructure. Here’s how air pressure systems contributed:
- A strong high-pressure system pushed Arctic air deep into the southern United States.
- Simultaneously, a low-pressure system from the Gulf of Mexico brought warm, moisture-laden air.
- When the two masses collided over Texas, the result was intense snowfall, freezing rain, and record-low temperatures.
The storm:
- Left millions without electricity due to overwhelmed and poorly winterised power grids.
- Caused over 200 deaths and billions in damages.
- Sparked debates on energy resilience, climate adaptation, and grid reform.
The Bigger Picture
With climate change, pressure systems are becoming more erratic. For instance:
- The polar vortex, usually held in place by the jet stream, can become dislodged and send Arctic air further south.
- Blocking highs, which stall over regions, can lead to prolonged heatwaves or cold snaps.
Understanding pressure systems is essential for predicting and preparing for extreme weather. Their evolving behaviour is not just a meteorological concern—it’s a socio-economic and humanitarian one too.
3. Ocean Currents
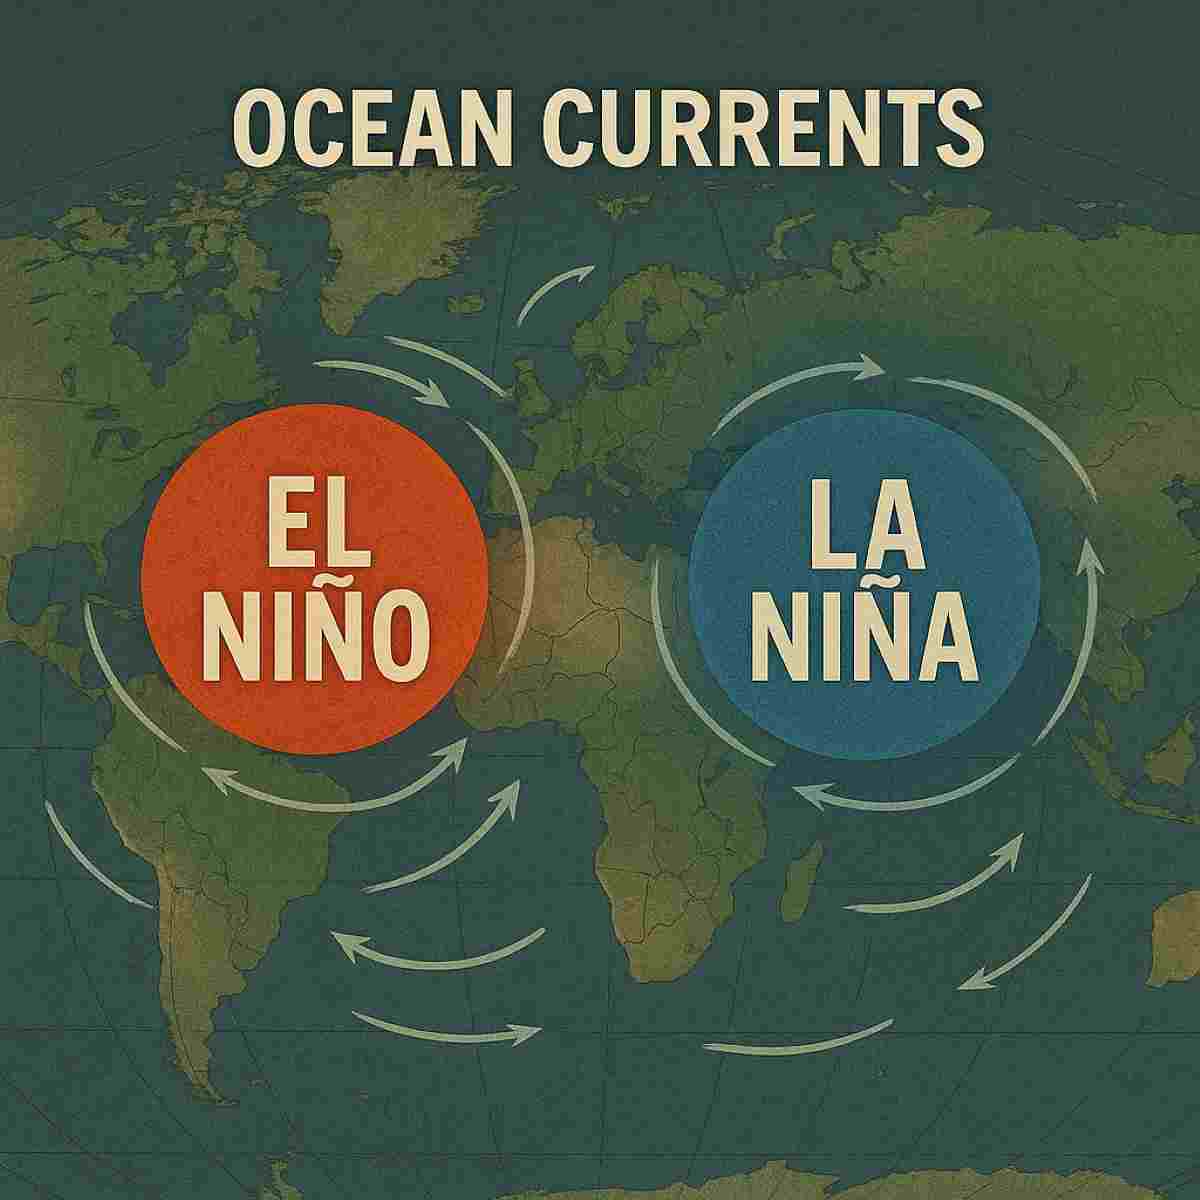
Oceans are not just vast bodies of water—they are climate regulators that absorb, store, and redistribute heat around the globe. Through a complex system of surface and deep-water currents, oceans transfer thermal energy from the equator toward the poles, moderating temperatures and shaping regional climates.
The two key types of ocean movement involved are:
- Surface currents, driven primarily by wind patterns and Earth’s rotation (Coriolis effect).
- Thermohaline circulation (also known as the global conveyor belt), driven by differences in water temperature and salinity that control the sinking and rising of ocean layers.
When this system is disturbed, it can create large-scale climate anomalies, the most notable of which are El Niño and La Niña, collectively known as the El Niño–Southern Oscillation (ENSO).
What Is El Niño?
El Niño is marked by the unusual warming of surface waters in the central and eastern tropical Pacific Ocean. This phenomenon typically occurs every 2 to 7 years and has global ripple effects:
- Disrupts rainfall patterns across Africa, Asia, and the Americas.
- Weakens trade winds, which can alter weather systems and reduce ocean upwelling (nutrient cycling).
- Leads to hotter global temperatures, often setting new heat records.
What Is La Niña?
La Niña is the opposite phase, characterised by cooler-than-average Pacific Ocean temperatures. It often brings:
- Heavier rainfall and floods in some regions.
- Droughts and wildfires in others.
- A temporary cooling effect on global temperatures.
Example: The 2024–2025 El Niño
The current El Niño event is among the most intense in recent years and has already begun reshaping weather patterns globally:
- South America:
- Countries like Chile, Argentina, and Brazil have faced extended heatwaves and wildfires.
- Coastal fishing industries in Peru and Ecuador have suffered from reduced fish stocks due to disrupted upwelling.
- Southern Africa:
- South Africa has experienced record-high temperatures, placing stress on water resources and agriculture.
- Zimbabwe and Zambia are battling severe drought conditions, threatening food security and hydroelectric power generation.
- Asia-Pacific:
- Southeast Asia has seen delayed monsoons and shifting rainfall patterns.
- Australia is bracing for a higher likelihood of bushfires and heat stress as summer approaches.
Long-Term Impact and Climate Link
El Niño and La Niña are natural cycles, but their frequency, duration, and intensity appear to be influenced by climate change. Warmer ocean baselines mean:
- El Niño events can amplify heat extremes.
- La Niña events may bring heavier storms and longer droughts.
Moreover, changing ocean dynamics also weaken the global conveyor belt, affecting everything from sea level rise to Arctic ice melt and hurricane development.
Understanding and monitoring these oceanic cycles is essential for climate forecasting, disaster preparation, and food and water security, particularly in vulnerable regions like sub-Saharan Africa, South America, and Southeast Asia.
4. Humidity and Temperature

Temperature and humidity are two of the most influential ingredients in the formation and intensification of extreme weather events. As the planet warms, the relationship between these two factors becomes more volatile and dangerous—fueling heavier rainfall, more frequent storms, and stronger hurricanes.
Warm Air and Moisture Retention
Warmer air has a greater capacity to hold water vapour. In fact, for every 1°C increase in temperature, the atmosphere can hold about 7% more moisture. This is a basic principle known as the Clausius-Clapeyron relation.
- As temperatures rise, especially near Earth’s surface, more moisture is absorbed into the atmosphere from oceans, lakes, soil, and vegetation.
- This stored moisture doesn’t just disappear—it gets released during condensation in the form of intense rainfall, hail, or snow, depending on the altitude and conditions.
When these warm, moisture-laden air masses collide with cooler air, they rise rapidly, cool, and condense—triggering thunderstorms, cyclones, or torrential downpours.
Storm Intensification and Global Warming
In addition to increasing rainfall potential, rising surface temperatures also supercharge storms:
- Hurricanes and cyclones feed on warm ocean waters. The hotter the sea surface, the more energy available to power these storms.
- Convective storms (like those seen in tropical regions) become more violent due to stronger upward air movement.
- Flash flooding is becoming more common as rain is dumped rapidly in shorter timeframes.
Worryingly, storms that once might have released their energy and dissipated are now lingering longer, moving slower, and releasing far more rain—leading to prolonged flooding and infrastructure collapse.
Example: Beijing’s Record-Breaking Rainfall in July 2023
In July 2023, Beijing experienced the heaviest rainfall in over 140 years, with some areas receiving more than 700mm of rain in just a few days—more than what the city typically gets in an entire month.
This unprecedented event was caused by:
- Exceptionally warm and moist air masses from the South China Sea and surrounding regions.
- The interaction with a typhoon system, which stalled over the region and continuously dumped moisture.
- Urban heat island effects, which further destabilised the local atmosphere.
The consequences were devastating:
- Widespread flooding submerged entire neighbourhoods.
- Transit systems were shut down.
- At least 33 people died, with billions of yuan in damages.
- Emergency response systems were overwhelmed, leading to policy reviews on disaster preparedness.
The Bigger Picture
These kinds of extreme events are becoming more frequent and intense as global temperatures rise:
- Eastern Africa is seeing more frequent deluges that destroy crops and infrastructure.
- The US and Europe are witnessing repeated “once-in-a-century” storms every few years.
- South Asia’s monsoon seasons are becoming erratic, dumping either too little or too much rain in concentrated periods.
Humidity and temperature no longer just determine whether we’ll need an umbrella—they now represent a dangerous feedback loop. As the world warms, so too does the potential for sudden, destructive atmospheric violence.
5. Climate Variability
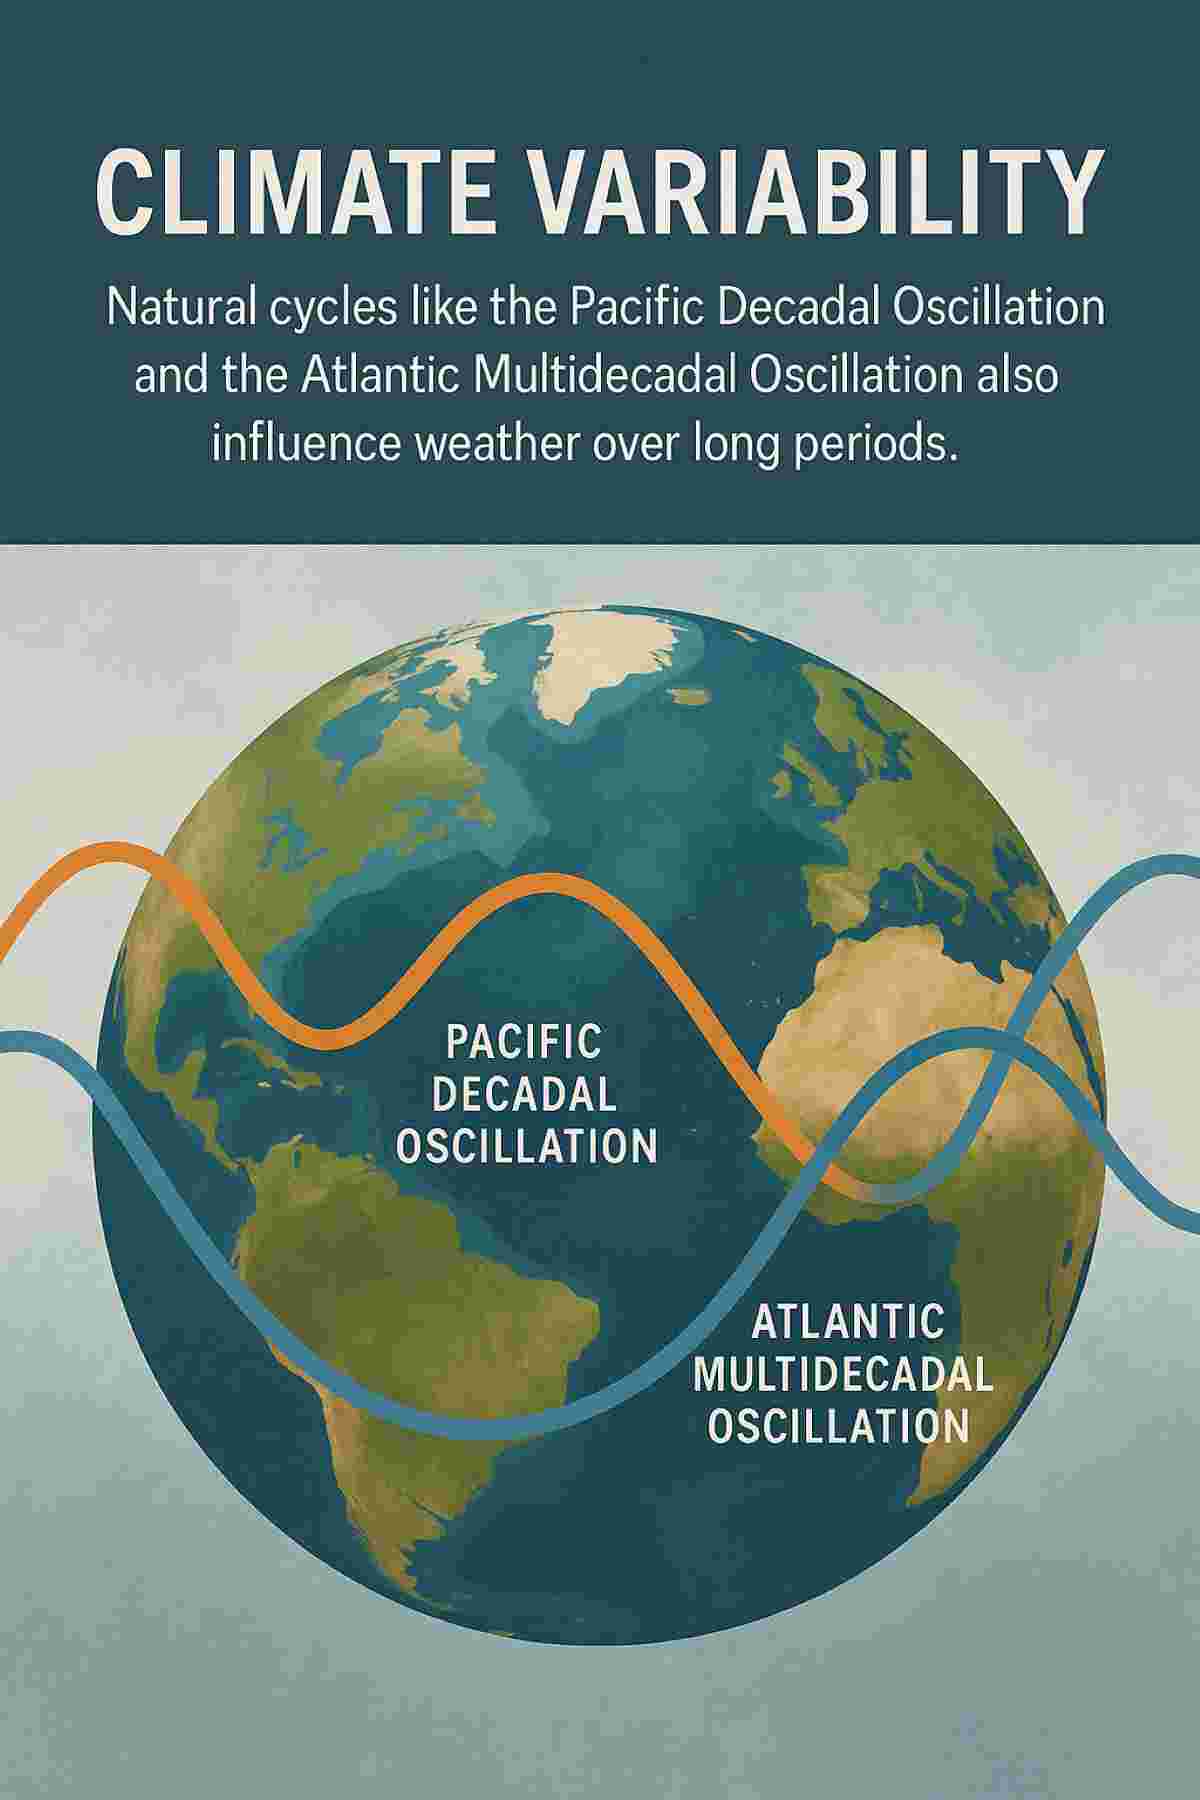
Beyond daily weather and seasonal changes, Earth’s climate is influenced by natural multi-decadal ocean-atmosphere cycles that play out over years and even decades. These cycles don’t get the same attention as short-term events like El Niño, but they have a profound effect on regional climates, rainfall patterns, drought frequency, and storm activity.
Two of the most influential long-term cycles are the Pacific Decadal Oscillation (PDO) and the Atlantic Multidecadal Oscillation (AMO).
What is the Pacific Decadal Oscillation (PDO)?
The PDO is a long-term fluctuation in sea surface temperatures (SSTs) in the North Pacific Ocean, cycling roughly every 20 to 30 years between two main phases:
- Warm (positive) phase: Warmer SSTs near the western coast of North America and cooler waters in the central Pacific.
- Cool (negative) phase: The pattern reverses, with cooler SSTs near North America and warmer waters further out.
These temperature shifts influence:
- Rainfall and drought patterns across North America, Asia, and parts of the Southern Hemisphere.
- The strength and location of the jet stream.
- The likelihood and intensity of tropical cyclones.
What is the Atlantic Multidecadal Oscillation (AMO)?
The AMO refers to long-term changes in SSTs in the North Atlantic Ocean, cycling approximately every 60 to 80 years. It also alternates between warm and cool phases:
- Warm AMO phase: Warmer North Atlantic waters lead to increased hurricane activity, wetter conditions in parts of Europe, and enhanced West African monsoons.
- Cool AMO phase: Typically linked to droughts in the Sahel, fewer hurricanes, and altered wind patterns across the tropics and subtropics.
Example: Droughts in Southern Africa and Monsoon Disruptions in Asia
Natural variability driven by the PDO and AMO has had far-reaching impacts:
- Southern Africa:
- Persistent multi-year droughts—like those in Zimbabwe, Namibia, and the Eastern Cape—have been partly attributed to the combined influence of a cool PDO and a warm AMO, which disrupt regional rainfall and ocean-driven wind patterns.
- These droughts reduce agricultural output, increase food insecurity, and weaken hydropower generation from dams like Kariba and Cahora Bassa.
- Asia:
- The Asian monsoon, vital for the livelihoods of over 2 billion people, is affected by shifts in both the PDO and AMO.
- A warm AMO phase has been associated with stronger Indian monsoons, while a cool PDO can weaken the monsoon, delaying its onset and causing flooding or crop failure due to erratic rainfall distribution.
The Climate Change Overlay
While these cycles are natural, their interaction with anthropogenic climate change is now a major concern:
- Climate change may amplify or prolong the phases of these oscillations.
- Some scientists believe that global warming is modulating the impacts of the PDO and AMO, making warm phases more extreme or altering their periodicity.
The net effect? Greater unpredictability. Droughts may last longer, floods may strike harder, and historical climate patterns may no longer be reliable guides for farming, infrastructure planning, or disaster management.
Understanding natural climate variability is essential for:
- Decadal forecasting
- Water resource management
- Agricultural resilience
- Regional disaster planning
As these long-term cycles continue to unfold, their interactions with rising global temperatures will define the next era of climate challenges.
Types of Extreme Weather Events
- Hurricanes & Cyclones: These massive tropical systems form over warm ocean waters and are powered by heat and moisture.
Recent Example: Hurricane Idalia (2023) made landfall in Florida as a Category 3 storm, causing billions in damage and record-breaking storm surges. - Tornadoes: Rapidly rotating columns of air spawned by severe thunderstorms.
Recent Example: In April 2024, a series of violent tornadoes swept across Oklahoma and Texas, killing dozens and levelling entire neighbourhoods. - Heatwaves: Prolonged periods of excessively high temperatures, often exacerbated by drought conditions.
Recent Example: In January 2025, parts of Australia saw temperatures soar above 48°C, sparking emergency declarations and heat-related hospitalisations. - Floods: Occur when rainfall overwhelms drainage systems or rivers overflow.
Recent Example: In March 2025, São Paulo, Brazil, suffered severe flash flooding that claimed over 50 lives and displaced thousands. - Droughts: Extended periods of low precipitation leading to water shortages.
Recent Example: Eastern Cape in South Africa continues to struggle with drought, affecting agriculture and livestock farming severely. - Blizzards: Severe snowstorms characterised by strong winds and low visibility.
Recent Example: In December 2024, the Great Lakes Blizzard in North America caused record snowfall and power outages for over a million residents.
How Technology Helps Us Understand The Hidden Science of Extreme Weather
Modern meteorologIn the past, humanity could only observe weather by looking at the sky and interpreting patterns. Today, thanks to cutting-edge technology, we can detect, analyse, and even predict extreme weather events days or weeks in advance—saving lives, protecting infrastructure, and informing global climate policy.
Modern meteorology combines satellite imaging, radar, computer modelling, and big data analysis to provide a comprehensive view of atmospheric and climatic behaviour, both short- and long-term.
1. Satellites: Watching Earth from Above
Weather satellites orbiting the Earth provide a real-time, global view of weather systems. Operated by agencies like NASA, NOAA, EUMETSAT, and JAXA, these satellites monitor:
- Cloud formation and movement
- Sea surface temperatures
- Storm development and rotation
- Volcanic ash plumes, wildfires, and atmospheric pollutants
Satellites are particularly crucial for tracking tropical storms, where early detection of cyclonic activity over oceans gives countries time to prepare.
🔍 Real-World Example:
In 2023, satellites from Japan’s Himawari-8 system monitored the formation and path of Typhoon Mawar. Thanks to this early data, tens of thousands of people in Guam and the Philippines were evacuated before the storm made landfall—reducing loss of life and helping governments mobilise emergency services.
2. Radar: Seeing Inside the Storm
Doppler radar and polarimetric radar provide detailed images of rainfall, hail, snow, and even wind speeds inside storm systems.
Radar is indispensable in:
- Tracking tornado formation and rotation
- Monitoring thunderstorm development
- Measuring rainfall intensity during floods
- Identifying freezing rain and sleet during winter storms
Radar systems allow meteorologists to issue localised warnings within minutes of detecting sudden intensification or dangerous formations.
3. Weather Models and Simulations
Numerical weather prediction models—run on supercomputers—simulate the atmosphere using real-world data. These include:
- The Global Forecast System (GFS)
- The European Centre for Medium-Range Weather Forecasts (ECMWF)
- The UK Met Office Unified Model
These models process billions of variables like wind speed, air pressure, ocean temperatures, and humidity to forecast:
- Hurricane paths
- Heatwaves
- Snowfall and blizzard likelihood
- Long-term climate shifts
With improved computing power, models are becoming more accurate and granular, offering precise forecasts days in advance and helping anticipate where and when the worst impacts may occur.
4. Climate Data Analysis: Decoding the Bigger Picture
Technology allows scientists to analyse centuries of historical climate data—including ice cores, tree rings, satellite records, and surface temperatures—to identify:
- Long-term climate trends
- Shifting storm seasons
- Increased storm intensity linked to global warming
This research helps policymakers and disaster agencies prepare for future risks and craft adaptive infrastructure strategies, such as relocating vulnerable communities or updating building codes.
Why This Matters
Without these tools:
- Warning systems would be delayed
- Emergency responses would be reactive, not proactive
- Economic losses and death tolls would skyrocket
Thanks to modern weather tech, early warnings for events like Cyclone Freddy in Africa (2023), Europe’s record-breaking heatwaves, and floods in Pakistan (2022) have helped save thousands of lives and enabled more efficient disaster response.
In Summary:
Technology is no longer a luxury in weather prediction—it’s a necessity. The fusion of space-based monitoring, AI-enhanced modelling, and real-time radar enables meteorologists to move from forecasting to life-saving action. As climate change fuels more frequent and intense weather, these tools are becoming our first and most vital line of defence.
Why Extreme Weather Is Getting Worse
While extreme weather is a natural phenomenon, climate change is amplifying its impact. Rising global temperatures are making conditions more favourable for stronger, more frequent, and more unpredictable events. Increased atmospheric moisture, shifting ocean currents, and melting polar ice all contribute to an unstable climate system.
According to the Intergovernmental Panel on Climate Change (IPCC), we are now seeing “once-in-a-century” weather events happening every few years, indicating how climate instability is accelerating.
Understanding the science behind extreme weather is key to preparing for and mitigating its effects. As climate patterns shift, scientific research and public awareness must grow in tandem to protect communities worldwide.
Being informed means being prepared — and in an era of climate uncertainty, knowledge is our most powerful defence.
Remember to read the following article to learn about the powerful and research based effects of traveling. Click here to read the full article